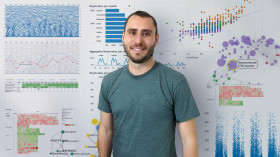
Introduction to Data Visualization
A course by Victor Pascual
Create interactive visualizations and learn to represent data from your favorite series
- 13,583
- 95% (564)

Data Visualization for Editorial Projects
A course by Diana Estefanía Rubio
Learn to interpret, create, and transform data into an attractive visual graph that communicates your message
- 5,865
- 98% (200)

Creative Infographics: Between Art and Journalism
A course by Jaime Serra Palou
Learn to visualize data in an artistic way through images and text
- 5,376
- 97% (228)

Data Visualization: Design Infographics in Illustrator
A course by Marco Giannini
Learn how to communicate complex information through meaningful data-driven images
- 5,542
- 99% (79)

Data Visualization and Information Design: Create a Visual Model
A course by Federica Fragapane
Bring clarity to complexity by creating an engaging data visualization piece that communicates information with ease
- 37,093
- 99% (912)

Infographic Design: Combine Art and Data
A course by Thales Molina
Explore the world of infographics and learn to build visual narratives from start to finish
- 4,991
- 97% (61)

Creative Data Visualization for Beginners
A course by Gabrielle Merite
Learn to create captivating narratives by combining digital illustration and collage techniques to design informative and eye-catching images
- 1,920
- 100% (28)

Information Design for Editorial Infographics
A course by Manuel Bortoletti
Learn to transform any topic, from tech to the environment, into a visual story by designing a clear and engaging infographic with Illustrator and InDesign
- 6,716
- 100% (171)