Data Visualization and Information Design: Create a Visual Model
A course by Federica Fragapane , Information Designer
Joined January 2021

Bring clarity to complexity by creating an engaging data visualization piece that communicates information with ease
When elegant design meets data visualization, reading and understanding complex information becomes a pleasant experience. Information designer Federica Fragapane is renowned for her ability to transform tables and numbers into an opportunity to tell a captivating story.
In this course, uncover the possibilities of data visualization and discover how to efficiently relay information with style. Learn how to find reliable sources, select the right information, and create a data visualization piece that is both informative and visually striking.
What will you learn in this online course?
17 lessons & 37 downloads
- 99% positive reviews (958)
- 41,421 students
- 17 lessons (2h 21m)
- 37 additional resources (11 files)
- Online and at your own pace
- Available on the app
- Audio: English, Spanish (Latam), French, Italian, Portuguese, Turkish
- Spanish · English · Portuguese · German · French · Italian · Polish · Dutch · Turkish · Romanian · Indonesian
- Level: Beginner
- Unlimited access forever
What is this course's project?
Create an information design piece that coveys multiple layers of information.

Projects by course students
Who is this online course for?
Anyone who wants to create intriguing but easy-to-read data visualization pieces.
Requirements and materials
Basic knowledge of Adobe Illustrator is required.
To take this course, you need access to a computer with internet connection and design software like Adobe Illustrator.

Reviews

Federica Fragapane
A course by Federica Fragapane
Federica Fragapane is an award-winning information designer based in Italy with a decade of experience. Her work bridges the gap between emotion, empathy, and information. Federica is also the creative force behind Google’s data visualization project The Shape of Dreams.
She has collaborated with organizations like the United Nations, BBC Science Focus, Wired, and Scientific American. Federica coauthored Planet Earth for NatGeoKIDS and Geopolitical Atlas of Water. In 2018, Federica was also invited to speak at OpenVis Conf in Paris and TEDxVerona, as well as EU DataViz at the Publications Office of the EU in 2019, and a virtual lecture at Design Lab, Harvard University in 2021. She also works with La Lettura, the cultural segment of the Italian newspaper Corriere della Sera.
Content
-
U1
Introduction
-
About Me
-
Influences
-
-
U2
About Data Visualization
-
Designing Visual Alphabets
-
The Broad Field of Data Visualization: Readers and Usage Context
-
The Relationship with the Readers
-
Collaboration
-
-
U3
Setting the Project in Motion
-
Finding the Data: The Sources
-
The Data
-
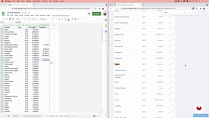
From Google Sheets to the Paper
-
-
U4
Visualizing the Data
-
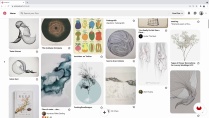
Visual Inspiration
-
Designing the Skeleton with RAWGraphs
-
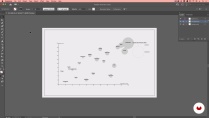
Editing with Adobe Illustrator 1
-
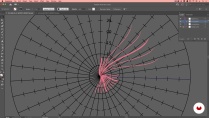
Adobe Illustrator 2
-
Adobe Illustrator 3
-
Always Keeping in Mind the Readers: Legends and Feedback 1
-
Always Keeping in Mind the Readers: Legends and Feedback 2
-
Finishing the Job
-
-
FP
Final project
-
Data Visualization and Information Design: Create a Visual Model
-
What to expect from a Domestika course
-
Learn at your own pace
Enjoy learning from home without a set schedule and with an easy-to-follow method. You set your own pace.
-
Learn from the best professionals
Learn valuable methods and techniques explained by top experts in the creative sector.
-
Meet expert teachers
Each expert teaches what they do best, with clear guidelines, true passion, and professional insight in every lesson.
-
Certificates
PlusIf you're a Plus member, get a custom certificate signed by your teacher for every course. Share it on your portfolio, social media, or wherever you like.
-
Get front-row seats
Videos of the highest quality, so you don't miss a single detail. With unlimited access, you can watch them as many times as you need to perfect your technique.
-
Share knowledge and ideas
Ask questions, request feedback, or offer solutions. Share your learning experience with other students in the community who are as passionate about creativity as you are.
-
Connect with a global creative community
The community is home to millions of people from around the world who are curious and passionate about exploring and expressing their creativity.
-
Watch professionally produced courses
Domestika curates its teacher roster and produces every course in-house to ensure a high-quality online learning experience.
FAQs
What are Domestika's online courses?
Domestika courses are online classes that allow you to learn new skills and create incredible projects. All our courses include the opportunity to share your work with other students and/or teachers, creating an active learning community. We offer different formats:
Original Courses: Complete classes that combine videos, texts, and educational materials to complete a specific project from start to finish.
Basics Courses: Specialized training where you master specific software tools step by step.
Specialization Courses: Learning paths with various expert teachers on the same topic, perfect for becoming a specialist by learning from different approaches.
Guided Courses: Practical experiences ideal for directly acquiring specific skills.
Intensive Courses (Deep Dives): New creative processes based on artificial intelligence tools in an accessible format for in-depth and dynamic understanding.
When do the courses start and when do they finish?
All courses are 100% online, so once they're published, courses start and finish whenever you want. You set the pace of the class. You can go back to review what interests you most and skip what you already know, ask questions, answer questions, share your projects, and more.
What do Domestika's courses include?
The courses are divided into different units. Each one includes lessons, informational text, tasks, and practice exercises to help you carry out your project step by step, with additional complementary resources and downloads. You'll also have access to an exclusive forum where you can interact with the teacher and with other students, as well as share your work and your course project, creating a community around the course.
Have you been given a course?
You can redeem the course you received by accessing the redeeming page and entering your gift code.


It's very detailed and useful course for everybody starting with data visualization.
Docente molto brava e professionale. Il corso mi è piaciuto molto nei contenuti e nel modo di comunicare.
Eu gostei muito deste curso. Nele a mediadora mostrou passos importantes do seu processo de trabalho que realmente dão clareza quanto a forma de trabalhar com a apresentação de informações. Diferentemente de outros cursos que, de forma muito superficial, no conteúdo apresentado, confundiram mais que informaram.
Great course, I am learning machine learning but also love good design which the tech world can sometimes lack. I wanted to find a way of visualizing my findings better rather than continuous use of he same old python libraries (seaborn, plotly, matplotlib etc) and this course was a step in the right direction. Grazie mille, Frederica.
Very inspiring lesson. Great work!