Data Visualization Course: Turning Data into Art
A course by Superdot – visualizing complexity , Superdot Studio Founders
Joined August 2021

Learn how to transform complex data into compelling visual stories with this comprehensive data visualization course.
Nicole Lachenmeier and Darjan Hil, accomplished graphic designers known for their unique approach to information design, will guide you through the art of translating complex data into visually engaging and comprehensible forms, such as posters.
With a portfolio adorned with awards like the Arch+ and Bauhaus competition, the German Press Agency Award, and the Kantar Information Is Beautiful Award, Nicole and Darjan will be your mentors in the realm of data visualization, a vital skill in today's information-driven world.
Discover the power of "data experience" through Nicole's expertise, known for her highly graphic, geometric, and colorful style. Learn how to make information not only informative but also aesthetically pleasing, structured, and accessible.
Then, Darjan, the analytical thinker, will teach you the art of dissecting and refining every chart, emphasizing the importance of innovative diagrams and different perspectives in abstraction.
What will you learn in this online course?
16 lessons & 21 downloads
- 93% positive reviews (14)
- 1,542 students
- 16 lessons (2h 26m)
- 21 additional resources (9 files)
- Online and at your own pace
- Available on the app
- Audio: German
- German · Spanish · English · Portuguese · French · Italian · Polish · Dutch · Turkish
- Level: Beginner
- Unlimited access forever
What is this course's project?
You'll create a visually stunning and informative poster. The project will challenge you to apply the skills you've learned in a practical context, translating data into a compelling visual format. By the end, you'll have a captivating poster that tells a story with data.
Who is this online course for?
This course is ideal for anyone intrigued by the art of data visualization. Whether you're a beginner or a seasoned designer, Nicole and Darjan will equip you with the tools and techniques to excel in this creative field.
Requirements and materials
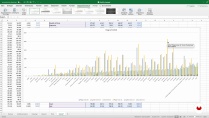
You'll need basic knowledge of Adobe Illustrator or a similar program. Additionally, access to Microsoft Excel will be beneficial. Gather your creative spirit, and let's explore the fascinating world of data visualization together.
Reviews

Superdot – visualizing complexity
A course by Superdot – visualizing complexity
Nicole Lachenmeier and Darjan Hil are accomplished graphic designers recognized for their innovative approach to data visualization. Their impressive portfolio includes awards from prestigious competitions and collaborations with esteemed publications and organizations. With Nicole's artistic flair and Darjan's analytical mindset, they bring a holistic approach to the world of data visualization. Explore their expertise and discover the art of transforming data into engaging visual narratives.
Content
-
U1
Introduction
-
About Us
-
Inspirations
-
-
U2
Working with data
-
Why visualize data
-
Find and select data
-
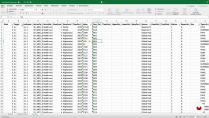
Prepare data for visualization
-
The data story
-
-
U3
Start visualizing
-
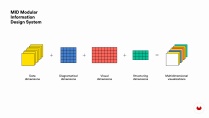
Modular information design
-
The first sketches
-
Visual dimensions
-
Different arrangement options
-
-
U4
Design the poster
-
The most important elements of a visualization
-
Build the visualization in Adobe Illustrator
-
Implement the visualization in Adobe Illustrator
-
Important design details
-
Text elements, highlights and legend
-
Further tips: Test and use the poster
-
-
FP
Final project
-
Data Visualization - Turning Data into Graphic Design
-
What to expect from a Domestika course
-
Learn at your own pace
Enjoy learning from home without a set schedule and with an easy-to-follow method. You set your own pace.
-
Learn from the best professionals
Learn valuable methods and techniques explained by top experts in the creative sector.
-
Meet expert teachers
Each expert teaches what they do best, with clear guidelines, true passion, and professional insight in every lesson.
-
Certificates
PlusIf you're a Plus member, get a custom certificate signed by your teacher for every course. Share it on your portfolio, social media, or wherever you like.
-
Get front-row seats
Videos of the highest quality, so you don't miss a single detail. With unlimited access, you can watch them as many times as you need to perfect your technique.
-
Share knowledge and ideas
Ask questions, request feedback, or offer solutions. Share your learning experience with other students in the community who are as passionate about creativity as you are.
-
Connect with a global creative community
The community is home to millions of people from around the world who are curious and passionate about exploring and expressing their creativity.
-
Watch professionally produced courses
Domestika curates its teacher roster and produces every course in-house to ensure a high-quality online learning experience.
FAQs
What are Domestika's online courses?
Domestika courses are online classes that allow you to learn new skills and create incredible projects. All our courses include the opportunity to share your work with other students and/or teachers, creating an active learning community. We offer different formats:
Original Courses: Complete classes that combine videos, texts, and educational materials to complete a specific project from start to finish.
Basics Courses: Specialized training where you master specific software tools step by step.
Specialization Courses: Learning paths with various expert teachers on the same topic, perfect for becoming a specialist by learning from different approaches.
Guided Courses: Practical experiences ideal for directly acquiring specific skills.
Intensive Courses (Deep Dives): New creative processes based on artificial intelligence tools in an accessible format for in-depth and dynamic understanding.
When do the courses start and when do they finish?
All courses are 100% online, so once they're published, courses start and finish whenever you want. You set the pace of the class. You can go back to review what interests you most and skip what you already know, ask questions, answer questions, share your projects, and more.
What do Domestika's courses include?
The courses are divided into different units. Each one includes lessons, informational text, tasks, and practice exercises to help you carry out your project step by step, with additional complementary resources and downloads. You'll also have access to an exclusive forum where you can interact with the teacher and with other students, as well as share your work and your course project, creating a community around the course.
Have you been given a course?
You can redeem the course you received by accessing the redeeming page and entering your gift code.


I was expecting something more, actually. There are some promising ideas, but few practical solutions.
Buen cueso, un enfoque diferente de lo tradicional. Excelente!
very interesting and helpful course
Hola. me ha gustado la vocacion que tienen ambos instructores. Tienen sus mentes en la ceracion de garficos y les han quedado muy bien. Yo con el tiempo voy a prender.
Si lo recomiendo el curso
Exellent