Creative Data Visualization for Narrative Designs
A course by Federica FragapaneInformation Designer
A course by Federica Fragapane, Information Designer

Embrace the expressiveness of shapes to turn important information into meaningful graphics that tell stories and resonate with an audience
Information designer Federica Fragapane has collaborated with the United Nations, BBC Science Focus, Wired, and Scientific American. She feels a strong responsibility to share artworks that communicate information in a visually engaging way, to encourage the exploration of important topics and issues.
In this online course, discover how to create narrative data visualizations by exploring multiple visual languages. Learn to harness the expressiveness of shapes and use organic forms to convey the life behind the data, turning complex information into captivating visuals that engage an audience.
What will you learn in this online course?
19 lessons & 37 downloads
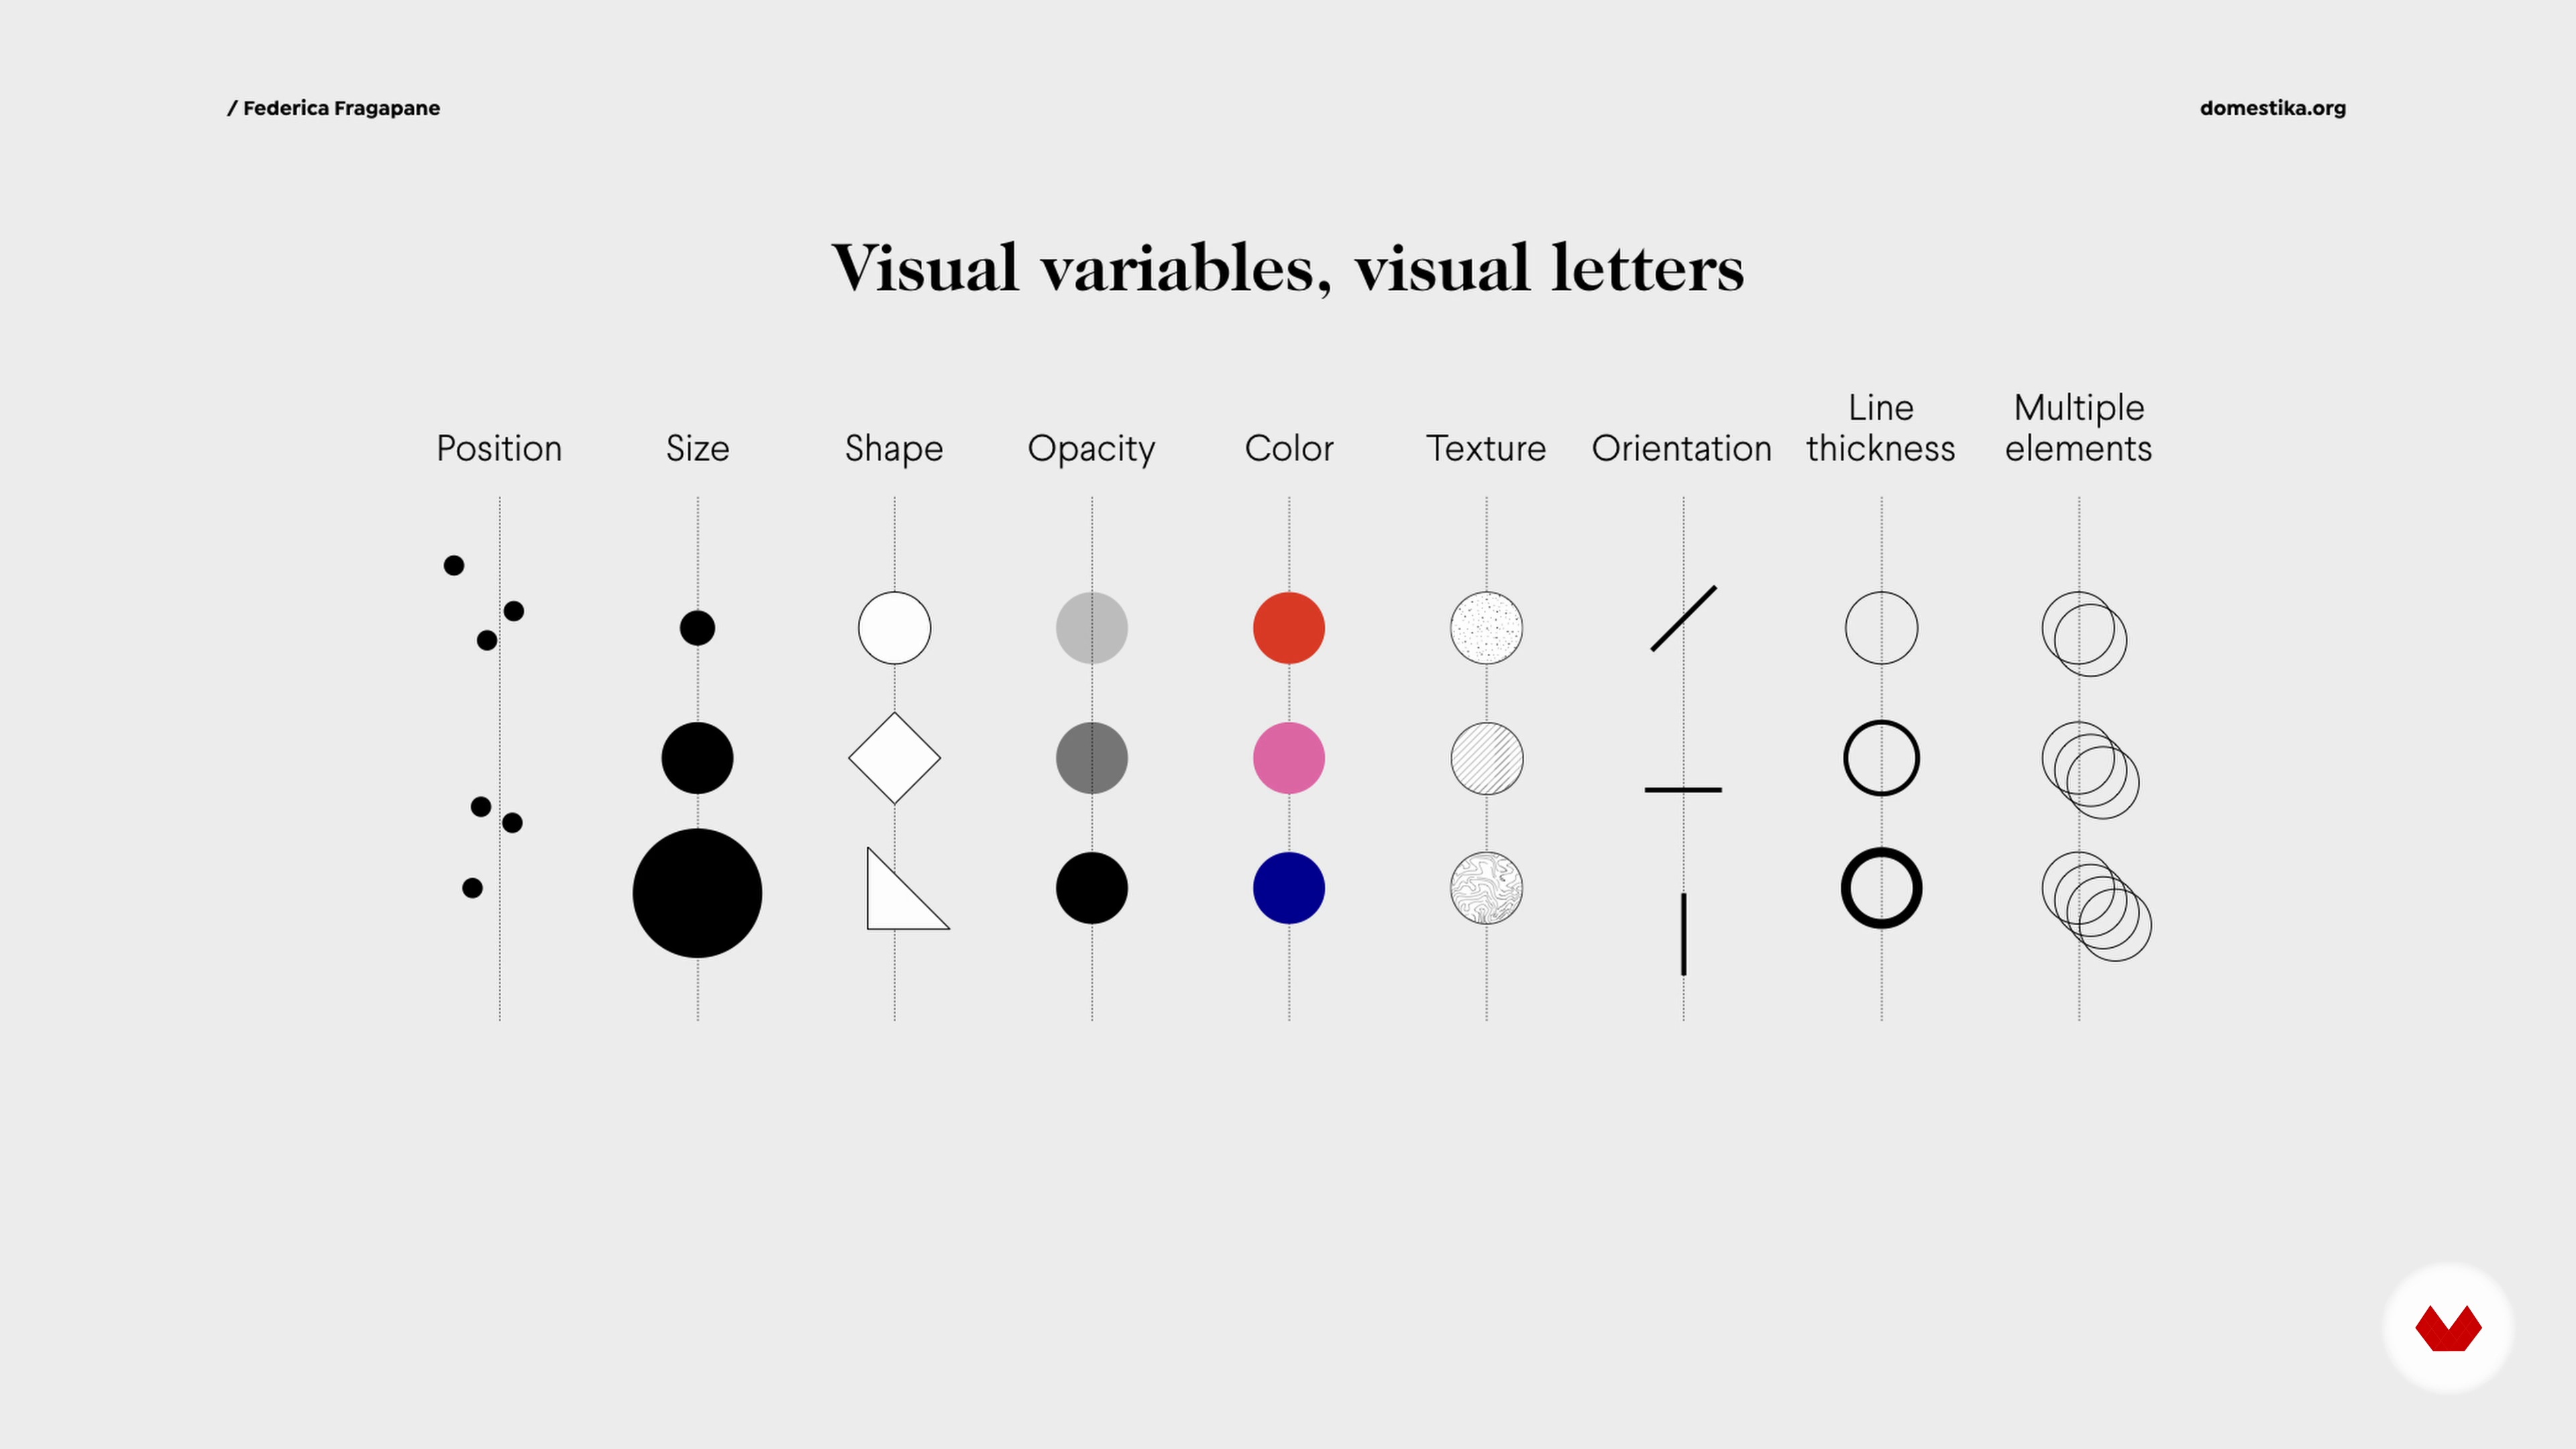
A Visual Translation of Contents: The Role of Perception
6 minutes, 0 seconds
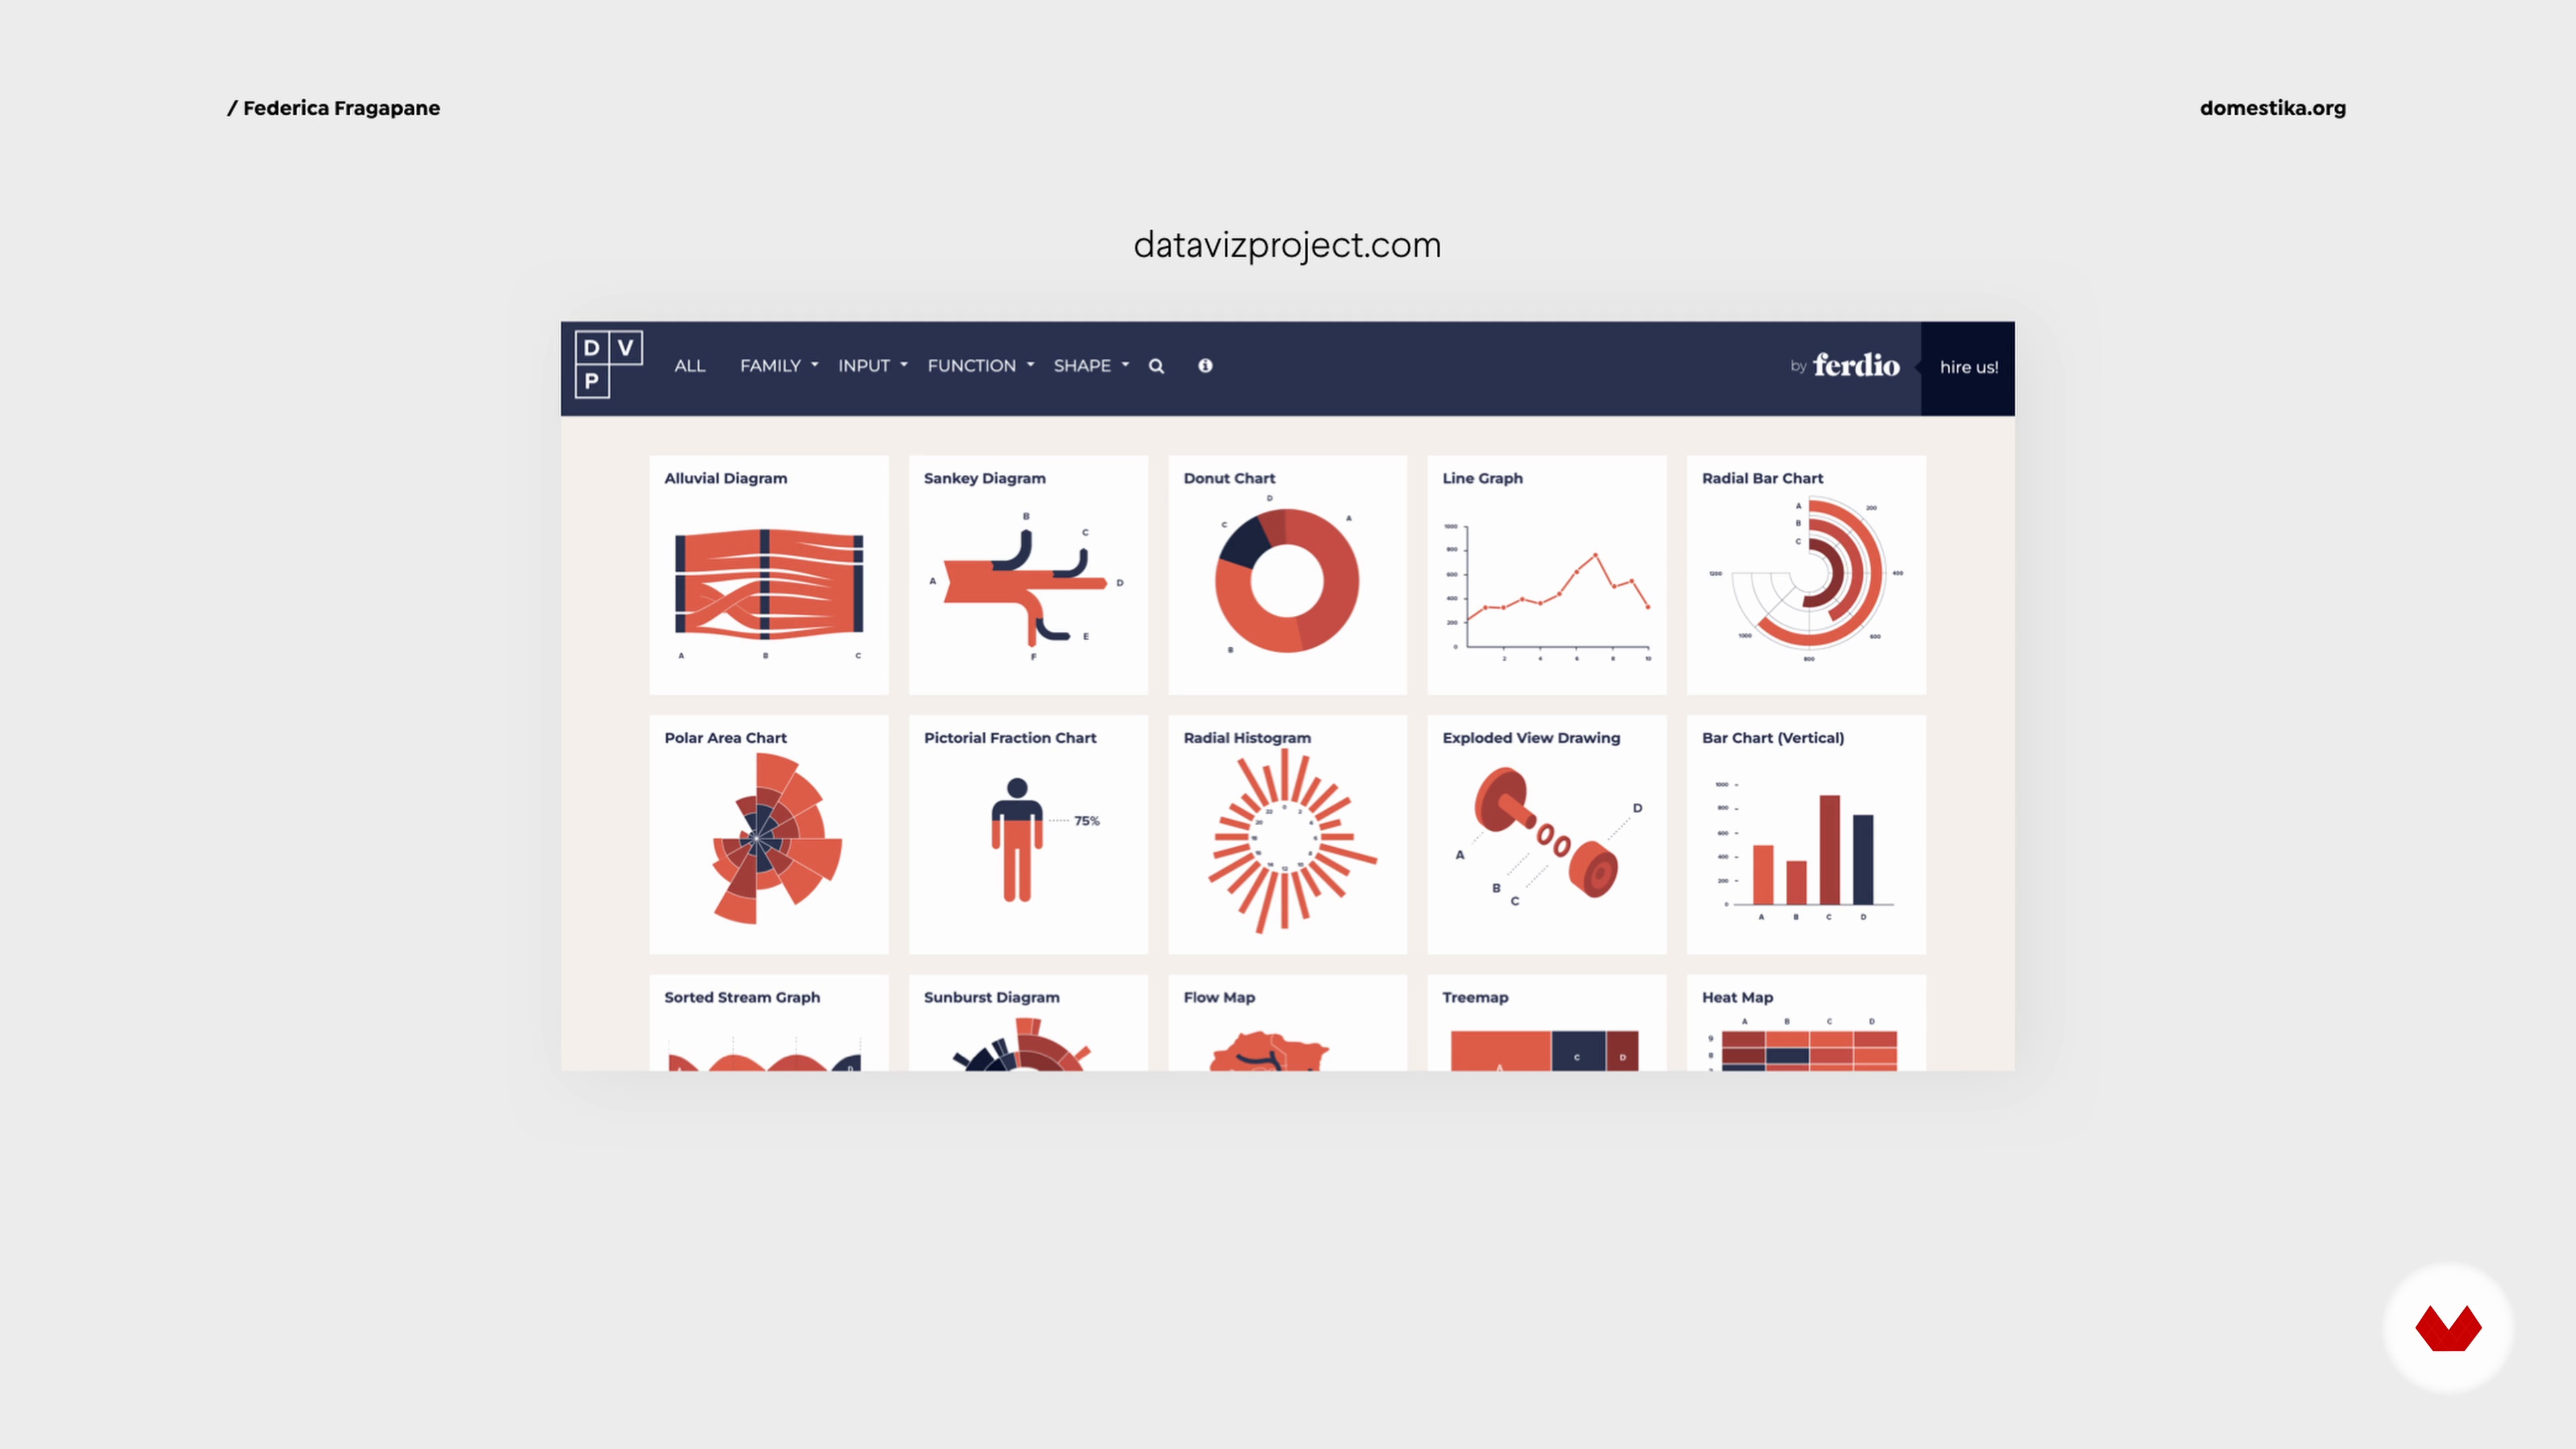
The Questions to Start With
5 minutes, 21 seconds
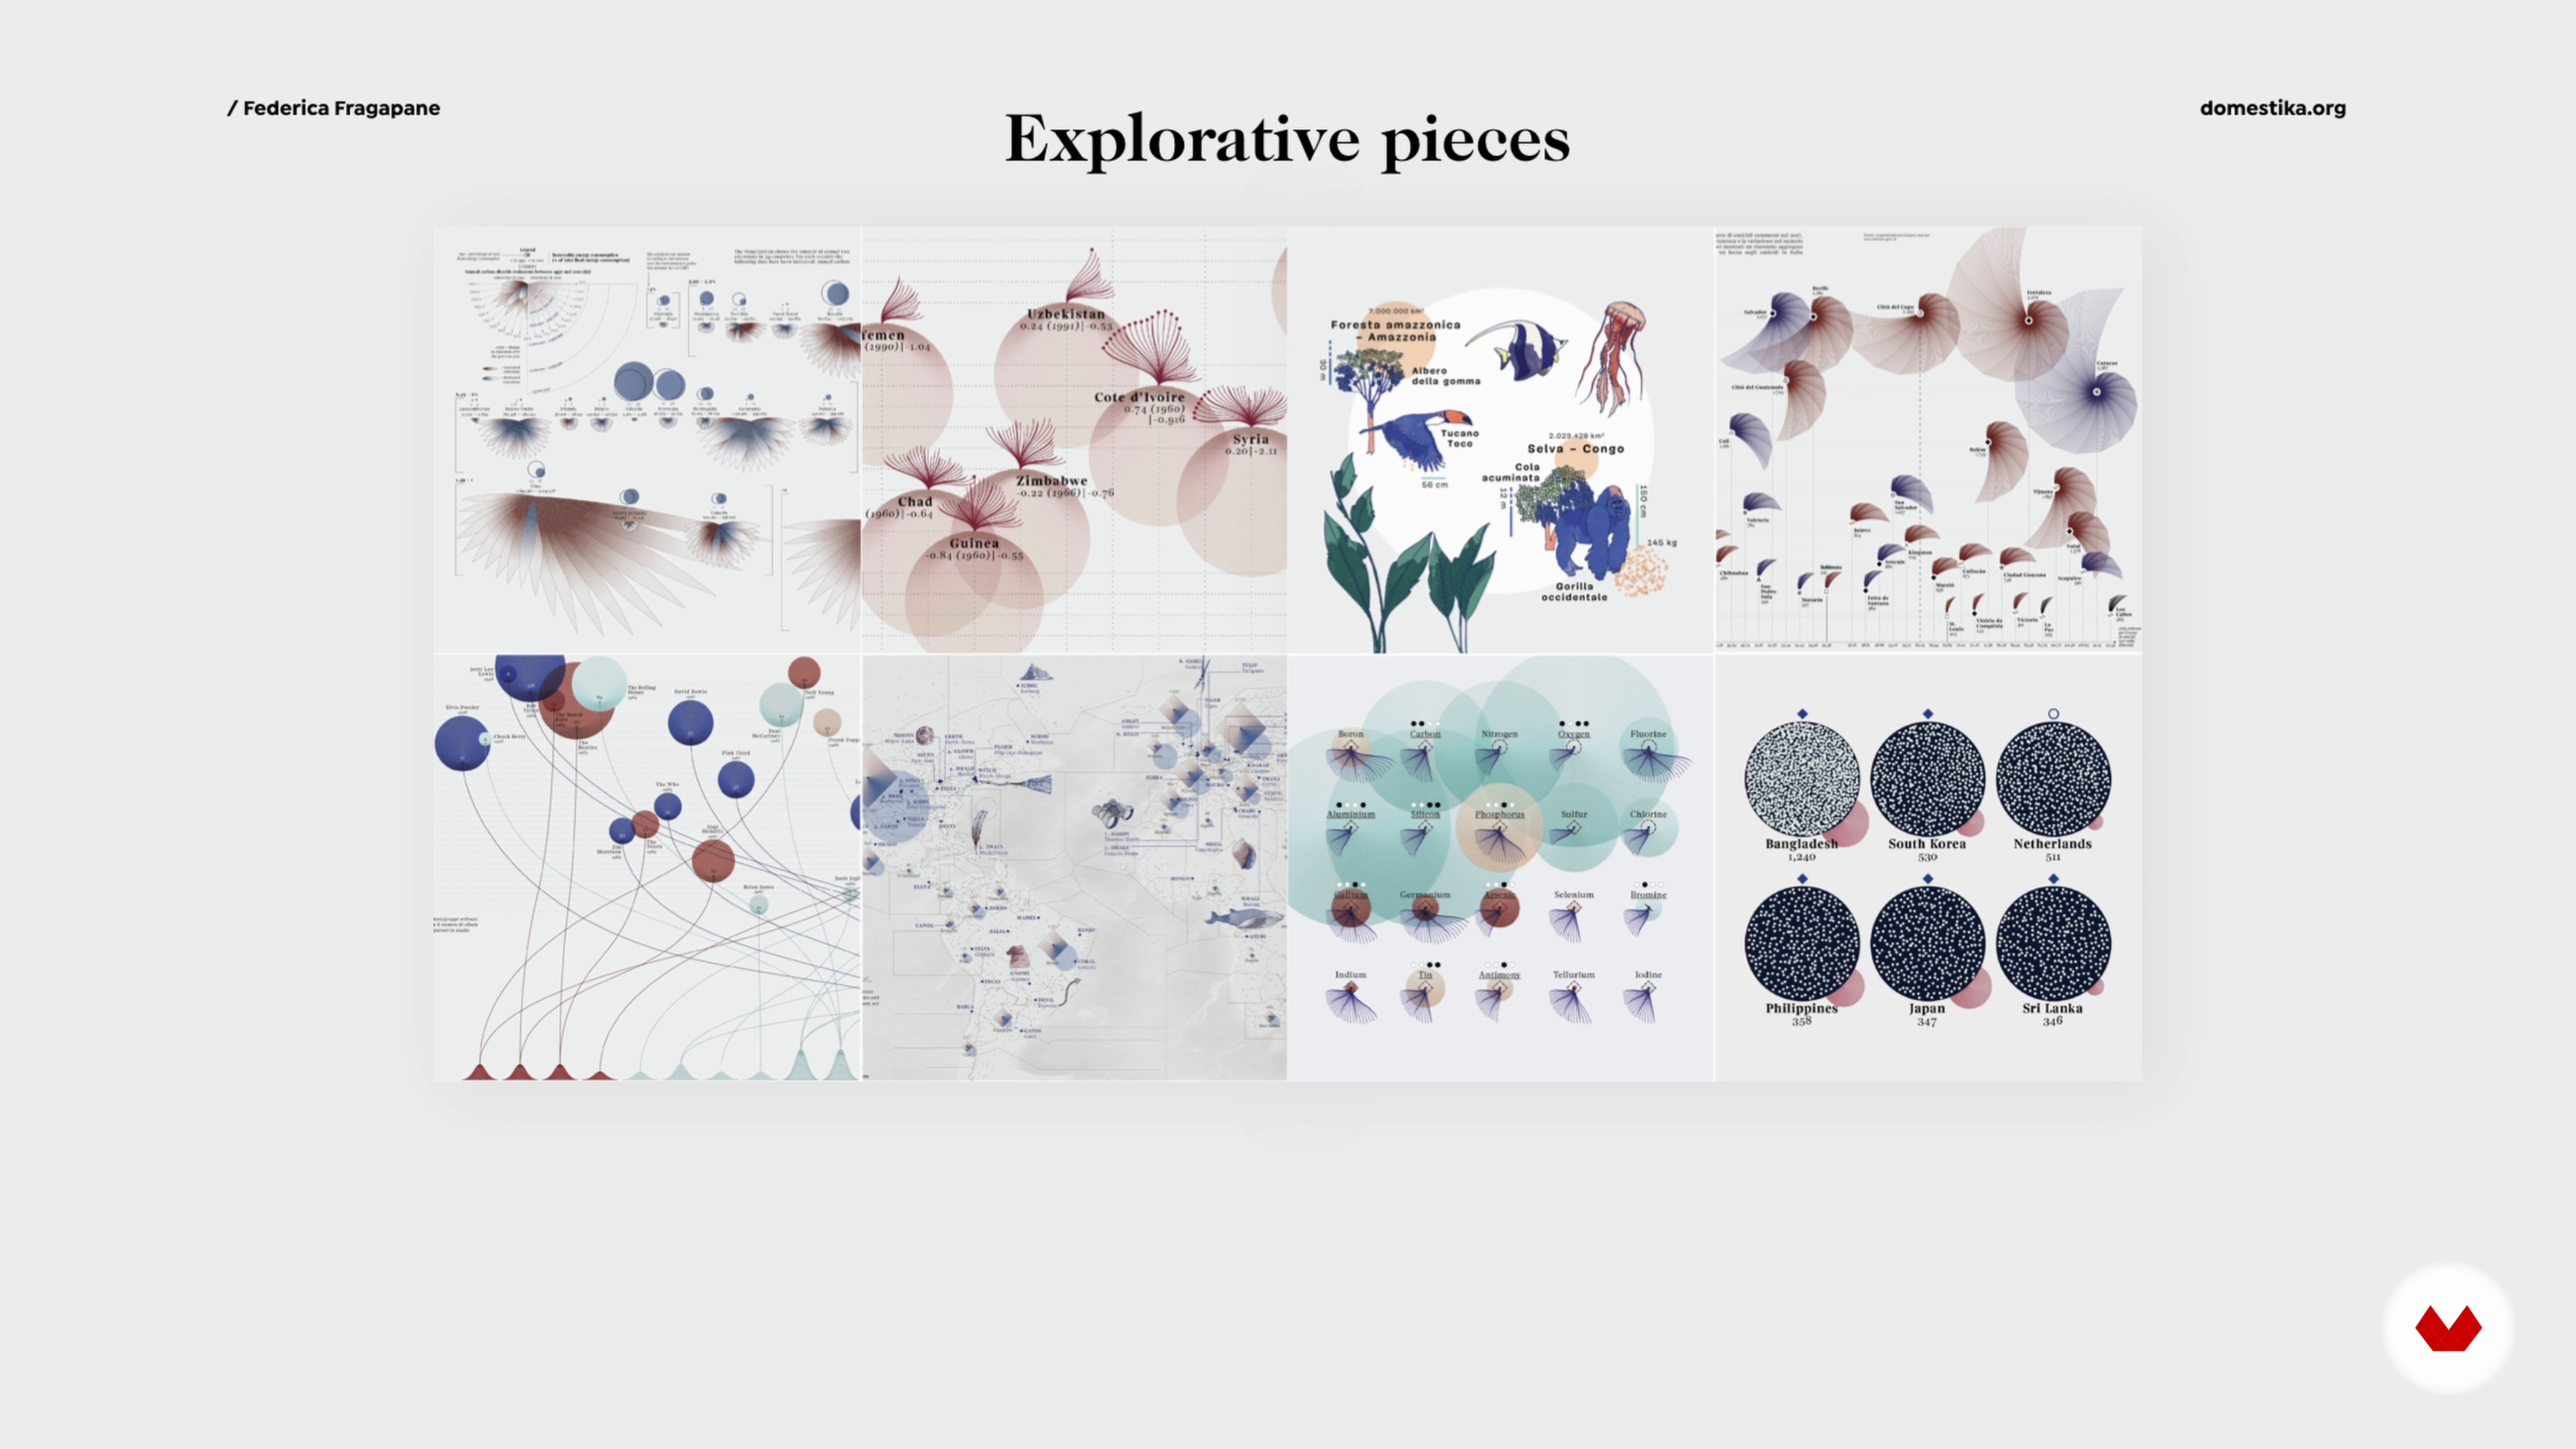
Visual and Written Words
4 minutes, 39 seconds
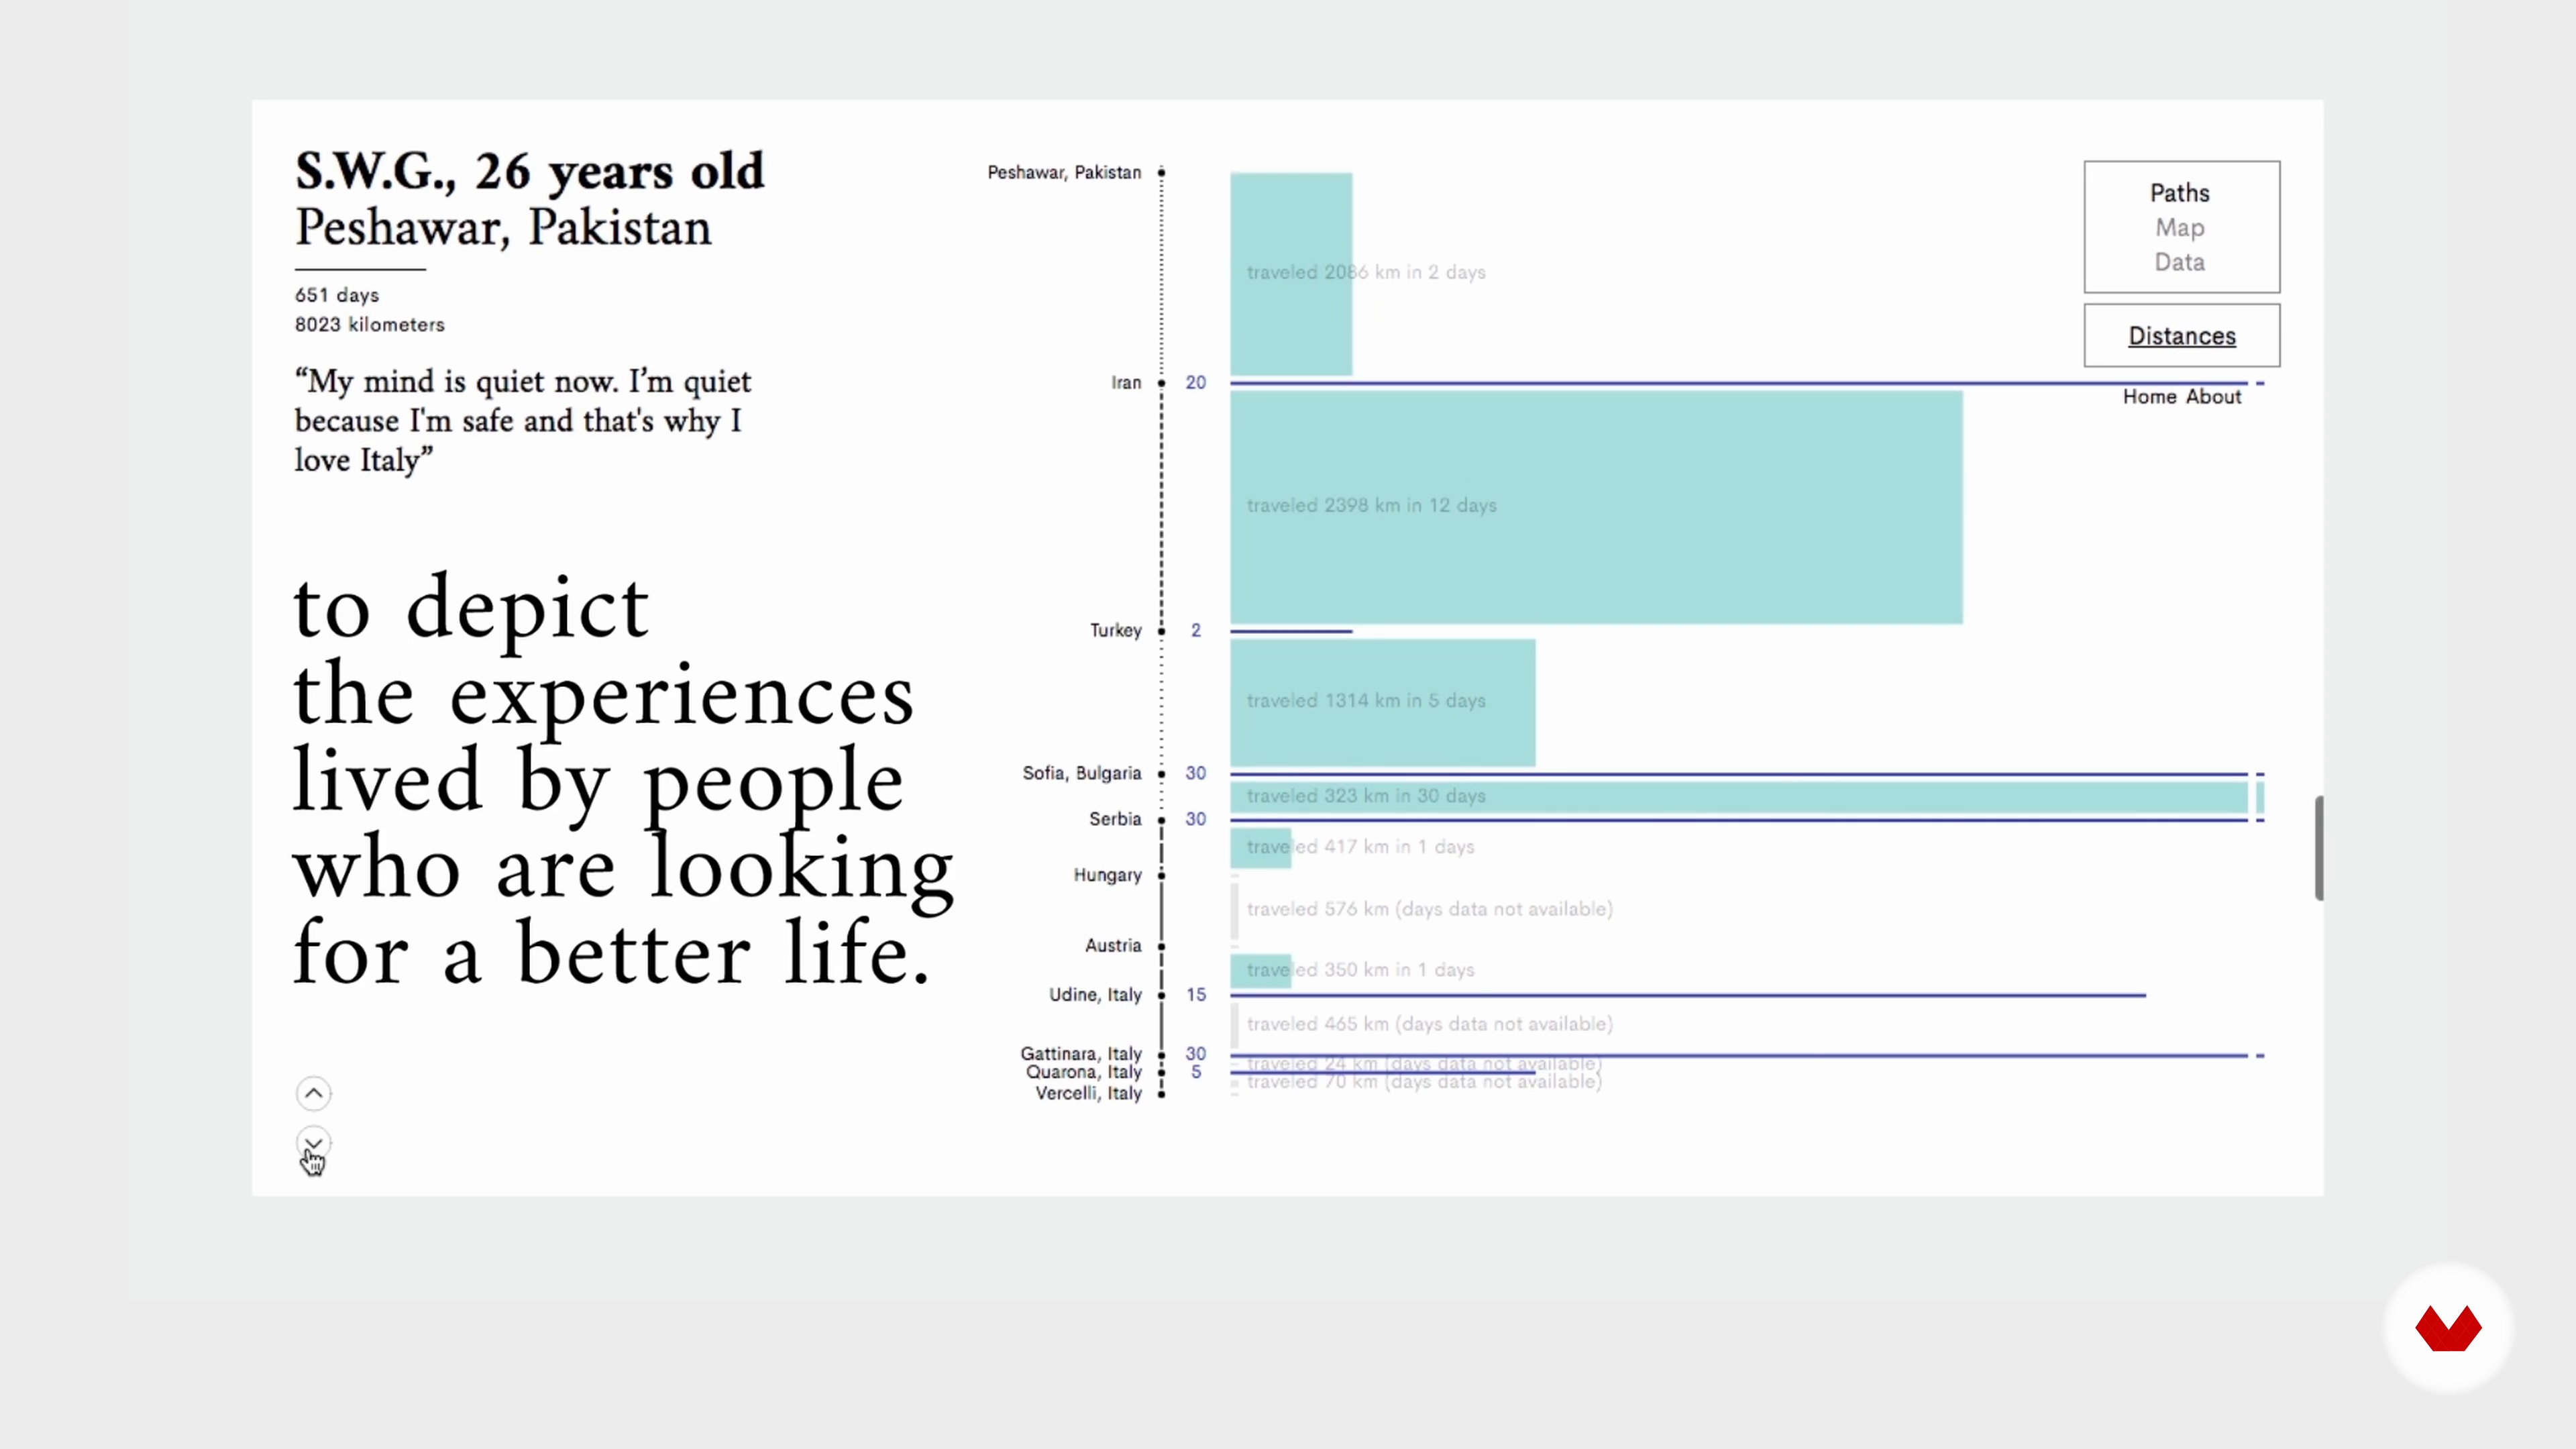
The Process of Telling Stories with Data
5 minutes, 16 seconds
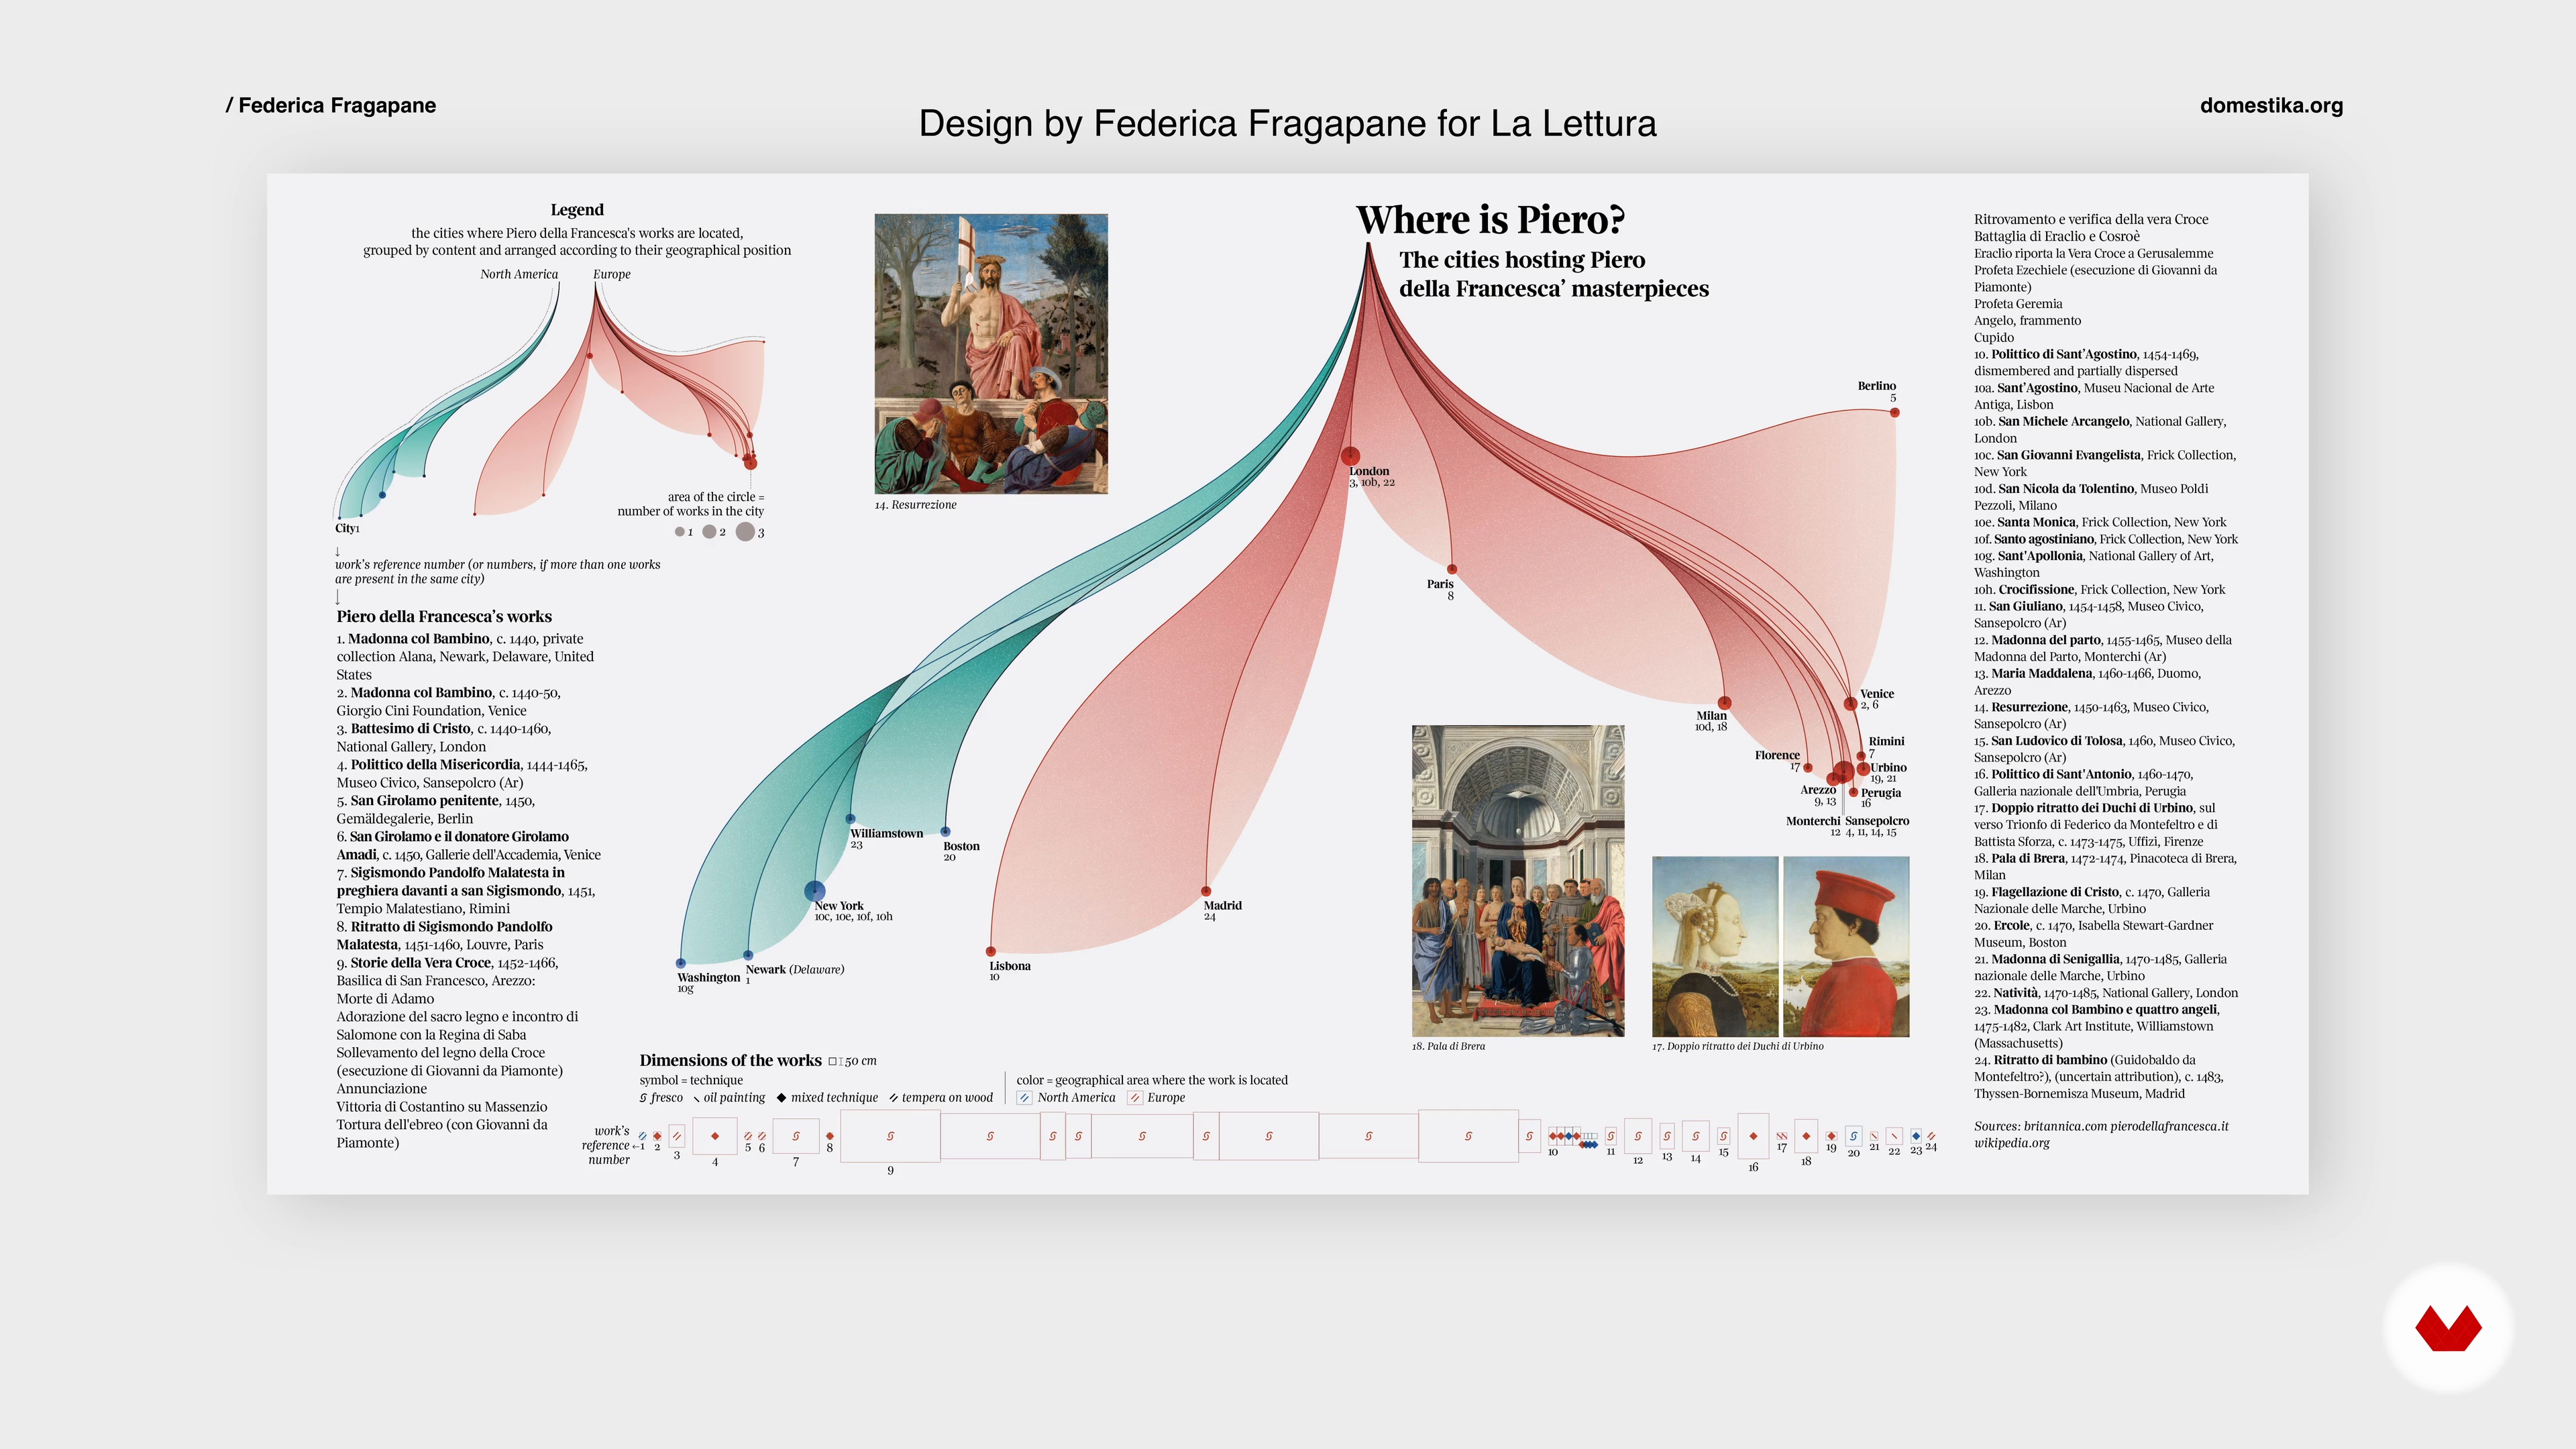
Using and Challenging Visual Metaphors
5 minutes, 25 seconds

Sketching: The Macrostructure of the Story
3 minutes, 47 seconds
What's included in this course?
Meet your teacher, Federica Fragapane. She talks about her career so far and how she started designing data visualizations. She also shares her views on design and her approach.
Begin with a brief introduction to the process of visually translating contents, and learn to analyze the role of reader perception. Then, your teacher proposes a series of questions to help approach any new project, including the role of written and visual words, before showing you how to tell stories with data. Explore some case studies and the use of complex visual metaphors.
Now it’s time to start developing your narratives. Select the topic and the story you want to tell, create the dataset with Google Sheets, and sketch the macrostructure of the story.
Next, it’s time to work with RAWGraphs and Illustrator. Design the different parts of your piece, focusing on the details, texts, legends, and finishing touches. To bring the course to a close, take a look at the different devices you can use to share your work.
What is this course's project?
Build a static, long-scrolling data visualization with different levels of information.
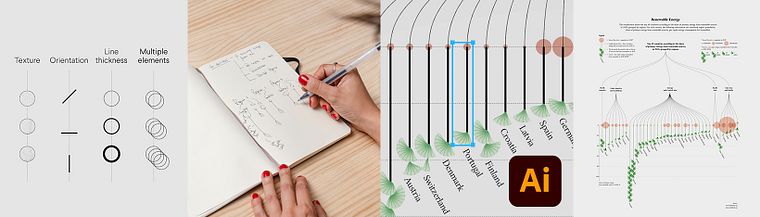
Projects by course students


Who is this online course for?
Anyone interested in learning to communicate complex data in an engaging way through design.
Requirements and materials
A working knowledge of Adobe Illustrator is essential for this course.
For materials, all you need is a computer with access to the software.
Reviews
- 14 days ago
Loved it
- 21 days ago
With some prior knowledge of data visualization, I had already heard about Federica Fragapane’s work, and discovering it was an absolute explosion of emotions for me. She elevates data visualization to the level of art. It is simply beautiful.
As a creative person, this course opened up a whole new world of possibilities and showed me that data visualization is not just about circles and squares. It is already present in nature...
Thank you so much for this wonderful reminder.
- 4 months ago
I enjoyed the course but I think the instructor chooses data that looks good in a way that is not realistic in real life. The same thing happened in her previous course. When I choose my data, parameters vary within broad ranges. Some circles end up barely visible and others huge. The data shown here is always so uniform but in real life it is rarely the case.
I also did not enjoy all the citations and metaphors, they felt unnecessary. I prefer to keep things succinct and to the point.
- 8 months ago
A very interesting course.
- 9 months ago
A very interesting course. It truly teaches you the process from the initial idea to its final execution, which is something to appreciate nowadays. Here, you can follow it step by step and understand how to use the tools to achieve a real result. Of course, this is a course to take as a starting point, and it will depend on each person how they continue exploring, practicing, and complementing it with other courses, readings, and tutorials.

She has collaborated with organizations like the United Nations, BBC Science Focus, Wired, and Scientific American. Federica coauthored Planet Earth for NatGeoKIDS and Geopolitical Atlas of Water. In 2018, Federica was also invited to speak at OpenVis Conf in Paris and TEDxVerona, as well as EU DataViz at the Publications Office of the EU in 2019, and a virtual lecture at Design Lab, Harvard University in 2021. She also works with La Lettura, the cultural segment of the Italian newspaper Corriere della Sera.
Content
- U1
Introduction
- About Me
- Influences
- U2
The Design of Visual Narratives
- A Visual Translation of Contents: The Role of Perception
- The Questions to Start With
- Visual and Written Words
- The Process of Telling Stories with Data
- Using and Challenging Visual Metaphors
- U3
The Data
- Selecting the Topic
- Creating the Dataset 1
- Creating the Dataset 2
- Sketching: The Macrostructure of the Story
- U4
Designing the Visualization
- RAWGraphs
- Adobe Illustrator: Creating the Visualization 1
- Adobe Illustrator: Creating the Visualization 2
- Adobe Illustrator: Creating the Visualization 3
- Adobe Illustrator: Refining the Visualization
- The Legend and the Text 1
- The Legend and the Text 2
- Final Details, Mobile Version, and Export
- FP
Final project
- Creative Data Visualization for Narrative Designs
What to expect from a Domestika course
Learn at your own pace
Enjoy learning from home without a set schedule and with an easy-to-follow method. You set your own pace.
Learn from the best professionals
Learn valuable methods and techniques explained by top experts in the creative sector.
Meet expert teachers
Each expert teaches what they do best, with clear guidelines, true passion, and professional insight in every lesson.
Certificates
PLUSIf you're a Plus member, get a custom certificate signed by your teacher for every course. Share it on your portfolio, social media, or wherever you like.
Get front-row seats
Videos of the highest quality, so you don't miss a single detail. With unlimited access, you can watch them as many times as you need to perfect your technique.
Share knowledge and ideas
Ask questions, request feedback, or offer solutions. Share your learning experience with other students in the community who are as passionate about creativity as you are.
Connect with a global creative community
The community is home to millions of people from around the world who are curious and passionate about exploring and expressing their creativity.
Watch professionally produced courses
Domestika curates its teacher roster and produces every course in-house to ensure a high-quality online learning experience.
FAQs
Data visualization transforms complex data into visual formats like charts, maps, and infographics, making information easier to understand. It combines narrative and visuals to tell compelling stories, highlight patterns, and engage audiences effectively.
This course is designed for learners with some experience in design or data handling. It is best suited for those at an intermediate level looking to deepen their skills in data visualization and storytelling.
Basic familiarity with spreadsheets and vector graphic software like Adobe Illustrator is recommended. Some prior experience with design principles and data handling will help you get the most out of the course.
You will learn to select appropriate chart types, design accessible color palettes, combine text and graphics, create interactive and static visualizations, and apply narrative strategies to engage audiences with data.
The course teaches how to combine visual elements and narrative structures to create data-driven stories. You'll learn to sequence information, use metaphors, and design for emotional and audience connections.
Yes, the course covers creating static visualizations for print and digital platforms as well as collaborating on interactive projects, ensuring you can work across multiple formats.
Yes, you'll learn workflows for publishing your projects online, sharing them on social media, and designing visualizations tailored for magazine print and digital publication.