Introduction to Data Visualization
A course by Victor Pascual , Data Visualization Specialist

Create interactive visualizations and learn to represent data from your favorite series
In this course by Víctor Pascual, discover what data visualization is, seeing how to distinguish between static and dynamic or interactive graphics.
Learn the basic rules to take into account when developing a visualization to help your critical analysis. As well as analyzing and communicating data, end up answering questions you hadn't even considered before!
What will you learn in this online course?
12 lessons & 9 downloads
- 95% positive reviews (589)
- 15,264 students
- 12 lessons (2h 46m)
- 9 additional resources (2 files)
- Online and at your own pace
- Available on the app
- Audio: Spanish, English, French, Italian, Portuguese, Turkish
- Spanish · English · Portuguese · German · French · Italian · Polish · Dutch · Turkish · Romanian · Indonesian
- Level: Beginner
- Unlimited access forever
What is this course's project?
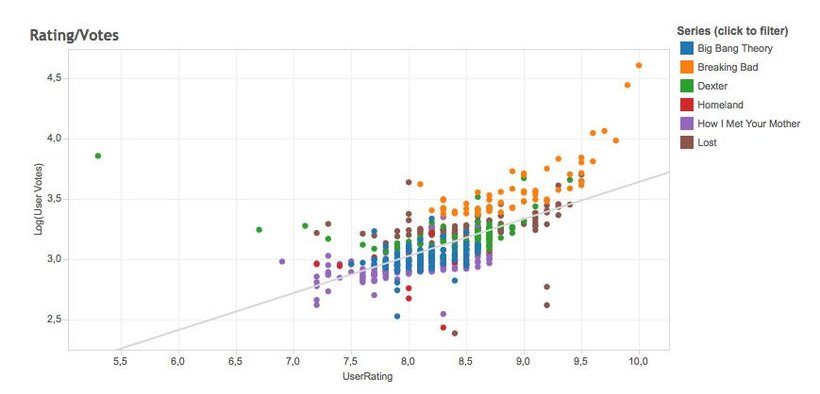
Visualize your favorite series interactively by learning to "scrape" or collect data on www.imdb.com and process it all in a spreadsheet. As a final result, discover the stories hidden behind the data by uncovering details that reflect how viewers have experienced these series.
Projects by course students
Who is this online course for?
This course is completely transversal and can be taken by people with all kinds of backgrounds. It is of special interest to designers, journalists, analysts, and online marketing professionals who want to learn how to extract value from and represent data.
Requirements and materials
No previous knowledge is required for this course.
In terms of materials, you need a computer with an internet connection and access to Google Sheets and the Tableau Public software.

Reviews

Victor Pascual
A course by Victor Pascual
Víctor Pascual is a self-confessed lover of scientific data visualization, who has a doctorate in computer science and digital communication. He dedicated his doctoral thesis to researching new methods for representing web data and has been a data scientist and data visualization specialist since 2009.
After three years as part of the Bestiario team, Víctor began his new adventure as a data analysis and visualization consultant for companies including SIRIS Academic and Mobile Media Content, where he leads a diverse range of R&D projects.
Víctor is also committed to training in information visualization, which led him to codirect Spain's first postgraduate course on the subject (IDEC) as well as participate in a number of different conferences and workshops. He currently collaborates with different master's and postgraduate degree programs.
Content
-
U1
Data Visualization
-
Víctor Pascual
-
Introduction to Data Visualization
-
Influences
-
-
U2
How to develop effective visualizations
-
The process of data visualization
-
Objectives and examples
-
Basic rules
-
-
U3
Data collection and analysis
-
Explanation of the project
-
Introduction to data scraping
-
Cleaning and data processing
-
Preparing the data
-
-
U4
Display data with Tableau
-
Introduction to Tableau Public
-
View data from our series
-
-
FP
Final project
-
Introduction to data visualization
-
What to expect from a Domestika course
-
Learn at your own pace
Enjoy learning from home without a set schedule and with an easy-to-follow method. You set your own pace.
-
Learn from the best professionals
Learn valuable methods and techniques explained by top experts in the creative sector.
-
Meet expert teachers
Each expert teaches what they do best, with clear guidelines, true passion, and professional insight in every lesson.
-
Certificates
PlusIf you're a Plus member, get a custom certificate signed by your teacher for every course. Share it on your portfolio, social media, or wherever you like.
-
Get front-row seats
Videos of the highest quality, so you don't miss a single detail. With unlimited access, you can watch them as many times as you need to perfect your technique.
-
Share knowledge and ideas
Ask questions, request feedback, or offer solutions. Share your learning experience with other students in the community who are as passionate about creativity as you are.
-
Connect with a global creative community
The community is home to millions of people from around the world who are curious and passionate about exploring and expressing their creativity.
-
Watch professionally produced courses
Domestika curates its teacher roster and produces every course in-house to ensure a high-quality online learning experience.
FAQs
What are Domestika's online courses?
Domestika courses are online classes that allow you to learn new skills and create incredible projects. All our courses include the opportunity to share your work with other students and/or teachers, creating an active learning community. We offer different formats:
Original Courses: Complete classes that combine videos, texts, and educational materials to complete a specific project from start to finish.
Basics Courses: Specialized training where you master specific software tools step by step.
Specialization Courses: Learning paths with various expert teachers on the same topic, perfect for becoming a specialist by learning from different approaches.
Guided Courses: Practical experiences ideal for directly acquiring specific skills.
Intensive Courses (Deep Dives): New creative processes based on artificial intelligence tools in an accessible format for in-depth and dynamic understanding.
When do the courses start and when do they finish?
All courses are 100% online, so once they're published, courses start and finish whenever you want. You set the pace of the class. You can go back to review what interests you most and skip what you already know, ask questions, answer questions, share your projects, and more.
What do Domestika's courses include?
The courses are divided into different units. Each one includes lessons, informational text, tasks, and practice exercises to help you carry out your project step by step, with additional complementary resources and downloads. You'll also have access to an exclusive forum where you can interact with the teacher and with other students, as well as share your work and your course project, creating a community around the course.
Have you been given a course?
You can redeem the course you received by accessing the redeeming page and entering your gift code.





Un curso claro que te lleva a traves del proceso, desde la toma de datos hasta la visualización. Muchos tips buenos
Las explicaciones super claras y el curso es muy util.
Un corso molto utile e chiaro. Lo consiglio
Muy bueno para quien comienza en el mundo de la visualización! Profesor elocuente!
Breve y conciso. Una mirada muy interesante sobre la expresion de los datos como un arte.